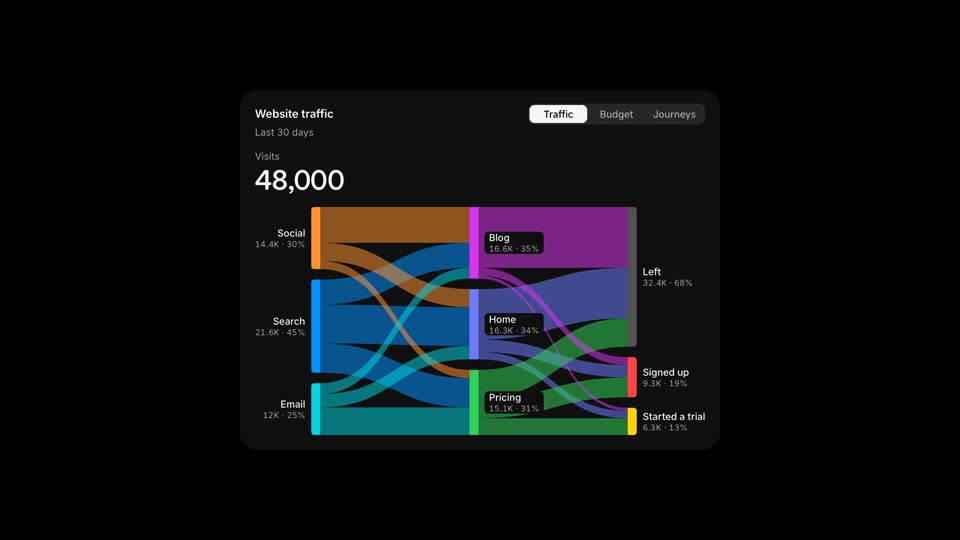
A dashboard card with a Sankey diagram whose ribbons pour in left to right, that lights every path through a hovered node or one hovered link as the headline rolls to its value, and morphs between three data sets.
Enter your email and we’ll send you a 6-digit code. No password to remember.
New here? The same code creates your account. By continuing you agree to the Terms and Privacy.